|
Topology |
|
Grain topology-size relationship: One important geometrical feature of the microstructure is the correlation between the number of faces per grain and the grain size. Due to the relaxation and coarsening process this correlation changes with time. However, we can see that the average number of faces s of a given grain of size R can be described within the quasi-stationary self-similar state by a self-similar time-invariant function of the relative grain size x. Figure 1a shows the number of neighbours of the individual grains in dependence on the relative grain size for the 500th time step. It can be seen that there is clearly a non-linear dependence of s on x, which can be approximated in the average by a parabolic function. This is consistent with experimental observations [Liu et al. (2002); Zhang et al. (2004)], theoretical considerations [Streitenberger(2006); Zöllner (2006)] and other 3D computer simulations [Marthinsen et al. (1996); Wakai et al. (2000); Di Nunzio (2001)]. 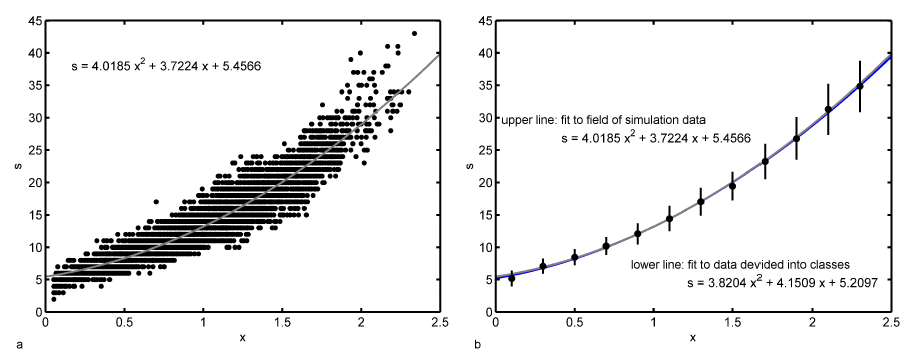 Figure 1: a - Number of faces s of grains of size x after 500 time steps together with a quadratic least-squares fit; b - Number of faces vs. relative grain size divided into size classes together with the standard deviation for each class, a quadratic least-squares fit (lower blue line) and the fit from Fig. a (upper grey line). In order to test the assumption that within the quasi-stationary self-similar state the faces-size-correlation is a self-similar time-invariant function the number of faces can be plotted versus the grain size for three different time steps, namely the 500th, 750th and 1000th, as can be seen in Figure 2a. Because of the rather broad scattering bands in the simulation data (cf. Figure 1a) the data have been divided into size classes. One can see that the data of all three time steps fall together very well. There are only larger deviations for large grain sizes. This originates in the fact that there are very few large grains so that a single grain may influence the mean value strongly. 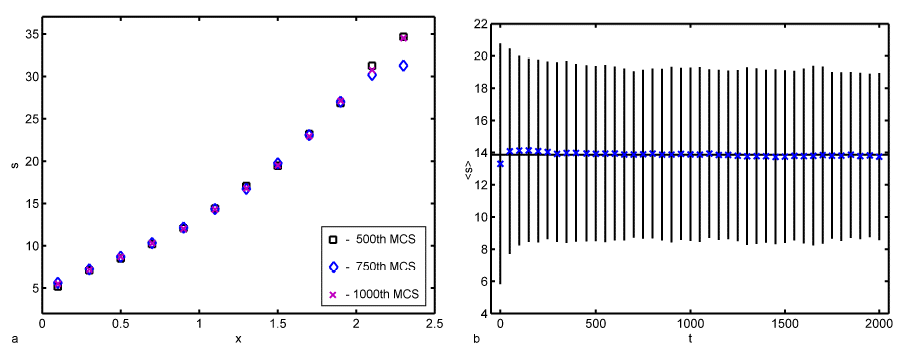 Figure 2: a - Number of faces vs. relative grain size for three different time steps divided into size classes; b - Temporal development of the mean number of faces of all grains together with the standard deviation. However, this time ivariant function can only be found in the quasi-stationary state. Within the initial period of the relaxation process the faces-size-correlation changes and therewith the mean number of faces < s > changes slightly from the initial value 13.3028 to the constant value of 13.8659 within the quasi-stationary self-similar state. There are only small fluctuations around this mean value but they can be neglected because the associated standard deviation is rather large (cf. Figure 2b). For example in the 500th time step < s > = 13.9286 and sd = 5.4345. The value of < s > = 13.8659 in the quasi-stationary self-similar state is close to 14 which is the value of the mean number of faces of Kelvin’s model ([Lord Kelvin (1887)]; cf. [Weaire (1996)]). Lord Kelvin’s model describes a possibility to fill a 3D space completely with objects of the same size. These so called tetrakaidecahedron have each 14 faces (eight hexagonal and six quadratic faces) which are slightly curved. This value is furthermore consistent with other observed simulation results that can be found in the literature [Krill and Chen (2002); Kim et al. (2005)]. Further geometrical parameters Another geometrical parameter of the grain ensemble is given by the Aboav-Weaire-law [Aboav (1970); Weaire (1974)] that states in three dimensions 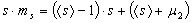 , ,where ms is the mean number of faces of all neighbouring grains of a central grain with s faces. μ2 is the second moment of the neighbour distribution (cf. crosses in Figure 3a), which is equal to the square of the standard deviation. In the 500th time step μ2 has a value of 28.2832 and the mean number of faces is given by < s > = 13.7069. It follows that s · ms = 12.7069 · s + 41.9901 with the values of < s > and μ2 as given above. While one can see in Figure 3b that there is a strict linear correlation between s · ms and s given by s · ms = 14.0302 · s + 24.236 as predicted by the Aboav-Weaire-law, the fitted coefficients however - especially < s > + μ2 - deviate from the theory, but are in good agreement with other simulation results. For example Wakai et al. (2000) found s · ms = 13.3 · s + 23.4 as it has been obtained by a least-squares fit to the simulation results of a Surface Evolver method which is in good agreement with the here presented Monte Carlo Potts model simulation results. 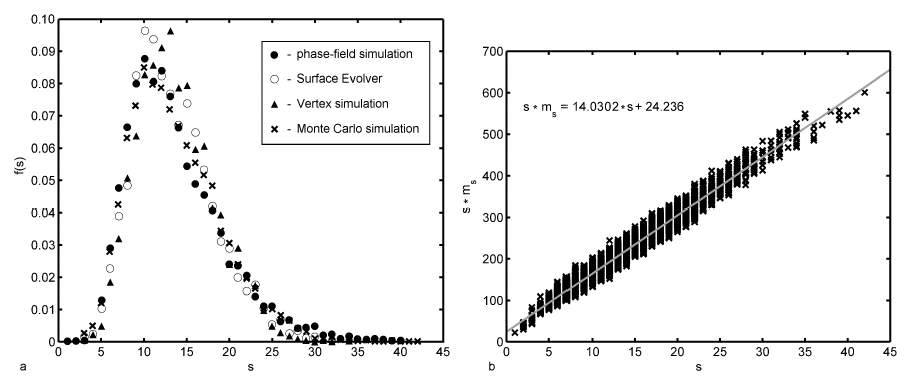 Figure 3: a - Number of neighbouring grains vs. relative grain size and b - Aboav-Weaire-law both after 500 time steps. The above mentioned distribution of neighbours or faces is shown in Figure 3a for the simulated microstructure also after 500 time steps (crosses) in comparison to three different simulation methods, namely the phase-field simulation, the Surface Evolver method and the Vertex method. These three distributions are taken from [Krill and Chen (2002)]. The original data are given for the phase-field simulation by Krill and Chen (2002), for the Surface Evolver method by Wakai et al. (2000) and for the Vertex simulation by Weygand et al. (1999). One can see clearly that all four simulation results fall together very well. For Monte Carlo simulation results to be discussed here it can be established that grains have at least three faces and at best 42 faces. The maximum is reached for ten faces. From the geometrical relations as shown in Figures 1 and 2 we can conclude that all grains divided into face classes yield size distribution depending on the number of faces. This fact is shown in Figure 4. One can see that indeed the size distribution depends strongly on the number of faces. There are few grains with few (for example five) faces showing a small standard deviation. With increasing number of faces the number of grains and the width of the distribution increases, reaches a maximum and then decreases again. 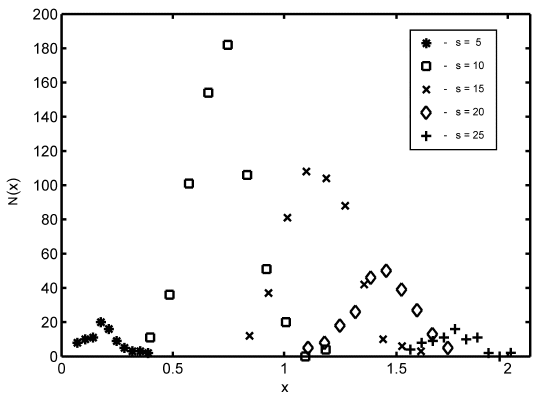 Figure 4: Number of grains vs. relative grain size after 500 time steps for grains with 5, 10, 15, 20 and 25 faces calculated separately. |
| [Liu et al. (2002)] | G. Liu, H. Yu, and X. Qin. Three-dimensional grain topology–size relationships in a real metallic polycrystal compared with theoretical models. Materials Science and Engineering A, 326:276, 2002. |
| [Zhang et al. (2004)] | C. Zhang, A. Suzuki, T. Ishimaru, and M. Enomoto. Characterization of three-dimensional grain structure in polycrystalline iron by serial sectioning. Metallurgical and Materials Transactions A, 35A:1927, 2004. |
| [Marthinsen et al. (1996)] | K. Marthinsen, O. Hunderi, and N. Ryum. The influence of spatial grain size correlation and topology on normal grain growth in two dimensions. Acta Materialia, 44:1681, 1996. |
| [Wakai et al. (2000)] | F. Wakai, N. Enomoto, and H. Ogawa. Three-dimensional microstructural evolution in ideal grain growth - general statistics. Acta Materialia, 48:1297, 2000. |
| [Di Nunzio (2001)] | P.E. Di Nunzio. A discrete approach to grain growth based on pair interactions. Acta Materialia, 49:3635, 2001. |
| [Lord Kelvin (1887)] | Lord Kelvin. On the division of space with minimum partitional area. Philosophical Magazine, 24:503, 1887. |
| [Weaire (1996) | D. Weaire. The Kelvin Problem, Foam Structures of Minimal Surface Area. Taylor & Francis, 1996. |
| [Krill and Chen (2002)] | C.E. Krill III and L.-Q. Chen. Computer simulation of 3-D grain growth using a phasefield model. Acta Materialia, 50:3059, 2002. |
| [Kim et al. (2005)] | Y.J. Kim, S.K. Hwang, M.H. Kim, S.I. Kwun, and S.W. Chae. Three-dimensional Monte-Carlo simulation of grain growth using triangular lattice. Materials Science and Engineering A, 408:110, 2005. |
| [Aboav (1970)] | D.A. Aboav. The arrangement of grains in a polycrystal. Metallography, 3:383, 1970. |
| [Weaire (1974)] | D. Weaire. Some remarks on the arrangement of grains in a polycrystal. Metallography, 7:157, 1974. |
| [Weygand et al. (1999)] | D. Weygand, Y. Bréchet, J. Lépinoux, and W. Gust. Three-dimensional grain growth: A vertex dynamics simulation. Philosophical Magazine B, 79:703, 1999. |
| [Streitenberger (2006)] | P. Streitenberger. private communication, 2006. |
| [Zöllner (2006)] | D. Zöllner. Monte Carlo Potts Model Simulation and Statistical Mean-Field Theory of Normal Grain Growth. Shaker-Verlag, Aachen, 2006. |
Datenschutzerklärung der Otto-von-Guericke-Universität Magdeburg nach DSGVO