|
Volumetric Rate of Change |
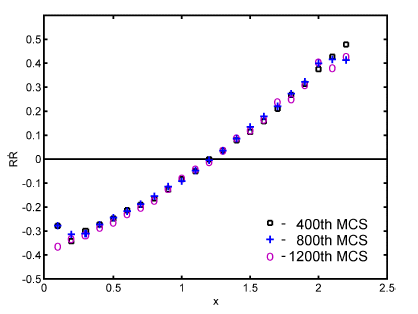
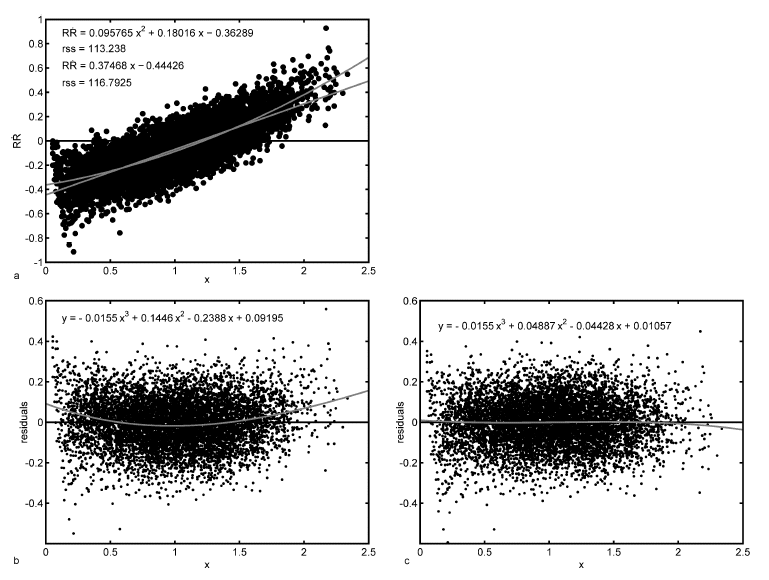
Aside from the initial period of time in the quasi-stationary state the growth of each grain can be described by the average self-similar growth law [Hillert (1965); Hunderi and Ryum (1980); Mullins (1998); Streitenberger and Zöllner (2007); Zöllner and Streitenberger (2007)] , ,according to which  is directly linked to the volume change rate is directly linked to the volume change rate  with with  . .The constant is calculated from the ratio  , ,where R is the radius of a volume-equivalent sphere with  yielding  . .Here G(x) and H(x) are time-invariant dimensionless functions depending only on the relative grain size x and are interrelated by  . .The constant k is the kinetic constant of curvature driven grain boundary motion (see Chapter Curvature Driven Kinetics) and b is given by  . .Therefore, the volume change rate depends only on the scaled grain size x and is time-independent and self-similar [Mullins (1986); Glicksman (2005)]. In order to test this assumption  vs. x has been plotted for the 400th, 800th and 1200th time step with the numerical values given by the simulation. The simulation data, divided into classes, of all three time steps fall together. There are only fluctuations for very small and very large grains (cf. Figure 1). vs. x has been plotted for the 400th, 800th and 1200th time step with the numerical values given by the simulation. The simulation data, divided into classes, of all three time steps fall together. There are only fluctuations for very small and very large grains (cf. Figure 1). Figure 1: Volume change rate vs. relative grain size after 400, 800 and 1200 time steps. One can see that there is a non-linear relation between  and x. For further investigations the volume change rate can be plotted versus the relative grain size for all grains of the ensemble after 500 time steps. and x. For further investigations the volume change rate can be plotted versus the relative grain size for all grains of the ensemble after 500 time steps.Figure 2a shows that the simulation data have a very broad scattering band. To the eye both a quadratic and a linear least-squares fits are good approximations. Although the quadratic one seems to be slightly better. To test this assumption that a quadratic function  gives a better approximation to the simulation data than a linear fit: gives a better approximation to the simulation data than a linear fit:
 is given in [Zöllner (2006)]. is given in [Zöllner (2006)].
|
| [Hillert (1965)] | M. Hillert. On the theory of normal and abnormal grain growth. Acta Metallurgica, 13:227, 1965. |
| [Hunderi and Ryum (1980)] | O. Hunderi and N. Ryum. The kinetics of normal grain growth. Journal of Materials Science, 1104, 1980. |
| [Mullins (1998)] | W.W. Mullins. Grain growth of uniform boundaries with scaling. Acta Materialia, 46:6219, 1998. |
| [Mullins (1986)] | W.W. Mullins. The statistical self-similarity hypothesis in grain growth and particle coarsening. Journal of Applied Physics, 59:1341, 1986. |
| [Glicksman (2005)] | M.E. Glicksman. Analysis of 3-d network structures. Philosophical Magazine, 85:3, 2005. |
| [Streitenberger and Zöllner (2007)] | P. Streitenberger and D. Zöllner. Topology based growth law and new analytical grain size distribution function of 3D grain growth. Materials Science Forum, Vols. 558-559, 1183-1188, 2007. |
| [Zöllner and Streitenberger (2007)] | D. Zöllner and P. Streitenberger. Normal Grain Growth in Three Dimensions: Monte Carlo Potts Model Simulation and Mean-Field Theory. Materials Science Forum, Vol. 550, 589-594, 2007. |
| [Zöllner (2006)] | D. Zöllner. Monte Carlo Potts Model Simulation and Statistical Mean-Field Theory of Normal Grain Growth. Shaker-Verlag, Aachen, 2006. |
Datenschutzerklärung der Otto-von-Guericke-Universität Magdeburg nach DSGVO
